
How do project managers ensure every task is completed in the right order and on time? Whether in construction, software, or managed IT support, A network diagram in project management provides the answer. It offers a visual representation of tasks and their dependencies, helping teams plan, schedule, and execute projects more effectively.
In this article, we explore what network diagrams are, how they function, their types, and why they are essential for successful project delivery.
What Are the Basics of a Network Diagram in Project Management?
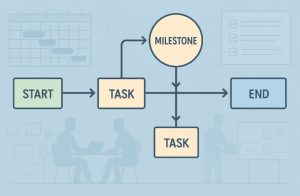
A network diagram in project management is a vital visual planning tool that displays a project’s tasks and their relationships through nodes and connecting arrows.
Each node typically represents a specific task, while the arrows illustrate the dependencies between these tasks. The primary purpose of such diagrams is to establish a clear sequence for executing project activities and identify any constraints that may arise due to these dependencies.
This diagrammatic representation helps project teams navigate through complex project activities by laying out the workflow logically and sequentially. By understanding how tasks interact and depend on one another, project managers can make better decisions, reduce delays, and allocate resources more effectively.
Beyond planning, network diagrams play a crucial role throughout the entire project lifecycle—from initial scoping and scheduling to progress monitoring and closure. They provide the necessary clarity to facilitate communication among stakeholders, align team efforts, and manage risks proactively.
What Is a Project Network and How Does It Function?
A project network refers to the entire framework of interrelated tasks that need to be performed to complete a project. It is essentially the blueprint of a project’s execution strategy. Through a network, the relationships, sequences, and dependencies between tasks are visualised, offering a comprehensive view of the project’s structure.
These networks are commonly represented using tools such as:
- PERT (Program Evaluation Review Technique) charts
- CPM (Critical Path Method) diagrams
- Network diagrams, which may follow ADM or PDM methods
These formats allow project managers to schedule tasks efficiently across various domains such as construction, managed IT support, and digital product development and understand the ripple effects of delays, and optimise both timelines and costs. A well-constructed project network ensures that all components contribute meaningfully to achieving project goals, without resource wastage or scheduling conflicts.
Why Are Network Diagrams Important in Project Management?
In any project, clarity is key. Network diagrams offer an immediate visualisation of a project’s logical flow, highlighting task sequences and their interdependencies. This structure helps managers identify which tasks can run in parallel, which must be done sequentially, and which are critical to maintaining the overall project schedule.
Network diagrams are especially helpful in the following areas:
- Clarifying Task Sequences: Understanding the correct order of operations ensures that prerequisites are met before dependent activities begin.
- Identifying the Critical Path: The critical path reveals the sequence of tasks that directly impacts the project completion time. Delays in these tasks cause project delays.
- Predicting and Managing Delays: When task dependencies are clearly visualised, potential bottlenecks and their cascading effects can be anticipated and mitigated.
- Supporting Resource Allocation: Knowing which tasks overlap and when resources are required ensures optimal allocation.
- Improving Communication: Stakeholders and team members can better grasp the project plan, status, and critical priorities through visual diagrams.
What Is a Project Schedule Network Diagram?
A project schedule network diagram is a specific application of a network diagram that focuses on the schedule and timing aspects of project tasks. It provides a chronological and logical structure of activities, making it easier to plan and monitor progress.
These diagrams are typically represented with nodes and arrows:
- Nodes (Boxes): Represent individual activities or milestones.
- Arrows (Lines): Indicate task relationships and the flow of work.
Each arrow represents a dependency type, such as Finish-to-Start (FS), Start-to-Start (SS), Finish-to-Finish (FF), or Start-to-Finish (SF).
Here’s a breakdown of the common dependency relationships:
| Relationship Type | Description |
| Finish-to-Start (FS) | Task B starts only after Task A finishes |
| Start-to-Start (SS) | Task B starts when Task A starts |
| Finish-to-Finish (FF) | Task B finishes when Task A finishes |
| Start-to-Finish (SF) | Task B finishes only after Task A starts (rarely used) |
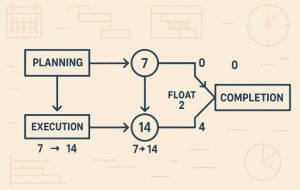
The critical path within the diagram represents the longest stretch of dependent activities and sets the minimum completion time for the project.
What Are the Main Components of a Project Schedule Network Diagram?
Every network diagram is built around core components that give structure to the project flow. Understanding each is key to interpreting the diagram correctly.
| Component | Description |
| Activities (Tasks) | The building blocks of the project; what needs to be done |
| Nodes | Boxes representing the beginning or end of an activity |
| Arrows | Lines showing the direction of task flow and dependencies |
| Relationships | Logical connections between tasks (FS, SS, FF, SF) |
| Critical Path | The longest chain of dependent tasks with zero slack |
| Slack/Float | The time a task can be delayed without affecting the overall project duration |
Accurate identification and placement of these elements are vital for an effective network diagram.
What Are the Different Types of Network Diagrams Used in Projects?
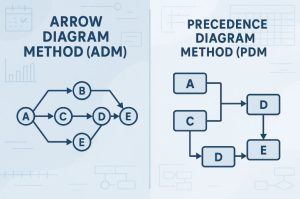
Two primary types of network diagrams are commonly used in project management: the Arrow Diagram Method (ADM) and the Precedence Diagram Method (PDM).
Arrow Diagram Method (ADM)
Also known as Activity on Arrow (AOA), this method uses arrows to represent activities and nodes to mark the beginning and end points.
Key characteristics of ADM:
- Arrows symbolise tasks
- Nodes signify events
- Only Finish-to-Start relationships are supported
- Dummy activities are sometimes needed to depict indirect dependencies
Although it was widely used in traditional project planning, ADM has largely been replaced by more flexible methods due to its limitations in handling complex relationships.
Precedence Diagram Method (PDM)
Also called Activity on Node (AON), this is the most popular and flexible diagramming technique used today.
In a PDM:
- Nodes represent activities
- Arrows show dependencies
- All four relationship types are supported
- Lead and lag times can be displayed directly
This method is better suited to modern projects due to its flexibility and ability to model complex task relationships clearly.
| Feature | Arrow Diagram Method (ADM) | Precedence Diagram Method (PDM) |
| Representation | Activities as arrows | Activities as nodes |
| Relationships supported | Only Finish-to-Start | FS, SS, FF, SF |
| Flexibility | Limited | High |
| Use of dummy activities | Required in many cases | Not required |
| Common use | Less common today | Widely used in modern projects |
How Can You Create a Network Diagram for a Project?

Creating a network diagram requires a methodical approach. The steps include:
- List all project tasks based on the Work Breakdown Structure (WBS).
- Determine dependencies for each task.
- Assign task durations based on estimates or historical data.
- Draw nodes and arrows to represent tasks and relationships.
- Identify the critical path using network analysis.
- Validate the diagram with stakeholders and make iterative updates as the project evolves.
Modern project management software like Microsoft Project, Wrike, or Lucidchart simplifies this process by offering templates and automation features for quick diagram creation.
How Do Network Diagrams Compare to Gantt Charts?
While both network diagrams and Gantt charts are essential project planning tools, they serve distinct purposes.
| Feature | Network Diagram | Gantt Chart |
| Focus | Logical sequencing and dependencies | Timeline and progress tracking |
| Best for | Planning and analysis | Execution and communication |
| Visual format | Nodes and arrows | Bars on a calendar grid |
| Complexity | More analytical | More visual and intuitive |
| Stakeholder suitability | More for internal use | Better suited for client reporting |
In many cases, project managers use both diagrams in tandem to gain a full view of the project’s structure and progress.
What Are the Benefits of Using Network Diagrams in Project Management?
Network diagrams offer numerous advantages beyond basic task mapping:
- They support strategic planning by aligning task sequences with project goals.
- They highlight the critical path, allowing teams to focus on tasks that directly impact timelines.
- They improve time and resource management by showing when resources are required and for how long.
- They act as risk management tools by exposing potential delays and interdependencies.
- They offer communication clarity, making it easier for teams and stakeholders to understand complex project plans.
By visually structuring the project, network diagrams allow for better control and execution from start to finish.
Can You Provide a Real-Life Example of a Project Network Diagram?

Consider a software development project with the following tasks:
- Requirements gathering
- UI/UX design
- Backend development
- Frontend development
- Integration testing
- Deployment
In a network diagram, the dependencies might look like this:
- Requirements gathering → UI/UX Design
- UI/UX Design → Backend and Frontend Development
- Backend & Frontend Development → Integration Testing
- Integration Testing → Deployment
This sequence helps the team track which tasks can be run in parallel and which need to be completed first, reducing delays and confusion.
In enterprise IT deployments, project network diagrams are also used to map out dependencies between servers, endpoints, routers, and firewalls. Teams often rely on managed IT services to implement and monitor these systems, while network management services ensure continuous communication between digital assets and reduce system downtime during transitions.
What Are Common Mistakes When Creating Network Diagrams?
Despite their usefulness, network diagrams can become problematic if not executed correctly. Common mistakes include:
- Overloading the diagram with too many details, making it difficult to read
- Failing to update the diagram as project changes occur
- Omitting task dependencies, leading to inaccurate critical path analysis
- Incorrect duration estimates, skewing timelines
- Neglecting slack time, causing overlooked delays
Avoiding these mistakes ensures the diagram remains a reliable planning and monitoring tool.
What Should Be Remembered About Network Diagrams in Project Management?
Network diagrams are more than just project visuals, they are foundational tools that provide the structure and logic needed for successful delivery. Whether you use the ADM or the PDM method, the key lies in understanding task relationships and sequencing them correctly.
With the right software tools and techniques, project teams can leverage network diagrams to gain visibility, coordinate efforts, and achieve better outcomes. They serve as a bridge between planning and execution, aligning people, processes, and priorities.
Frequently Asked Questions
What is the purpose of a network diagram in project management?
It serves as a visual representation of tasks and their relationships, helping project managers coordinate schedules, identify risks, and optimise resource use.
How is a critical path identified in a network diagram?
The critical path is determined by tracing the longest sequence of dependent activities with zero slack time. Any delay in these activities affects the overall project duration.
Can network diagrams be used for all project types?
Yes. From IT and construction to healthcare and event planning, network diagrams are applicable across industries where sequencing and task dependencies matter.
What tools can be used to create project network diagrams?
Popular tools include Microsoft Project, Lucidchart, Wrike, diagrams.net, and Adobe Workfront. Each offers customisable templates and automated features.
How is a PERT chart different from a network diagram?
A PERT chart is a type of network diagram focused on time estimation under uncertainty, whereas general network diagrams focus on task dependencies and flow.
What are common challenges in developing a network diagram?
Challenges include managing complexity, ensuring accuracy, updating the diagram regularly, and clearly communicating dependencies.
Do Agile project managers use network diagrams?
In Agile environments, full network diagrams are less common, but simplified versions may be used during release planning or in hybrid Agile-waterfall approaches.